How to create a BIP report in Oracle SaaS
In this article, I’ll demonstrate how to create a simple BIP report in the Oracle Fusion SaaS and the steps involved in it.
What is Oracle BI Publisher?
Oracle BIP stands for Oracle Business Intelligence Publisher which is a reporting tool in SaaS to extract data and represent it in various forms such as PDF, Excel, CSV, XML, etc.
Prerequisites:
Below are pre-requisites to complete this article:
- Oracle Fusion SaaS Instance with necessary roles to create reports
- Basic knowledge of SQL
Steps to create BIP reports
The following are the high-level steps to create BIP reports:
- Data Model: Data Model is the source of data, where the developer can write the SQL code as per requirement.
- Report: Report is the representation layer where the developer has to attach the templates ( RTF, E-Text, Excel, XSLT, etc.). The report needs to be linked with Data Model to extract data.
Let’s go ahead and create the Data model and Report in Oracle SaaS.
Creating Data Model
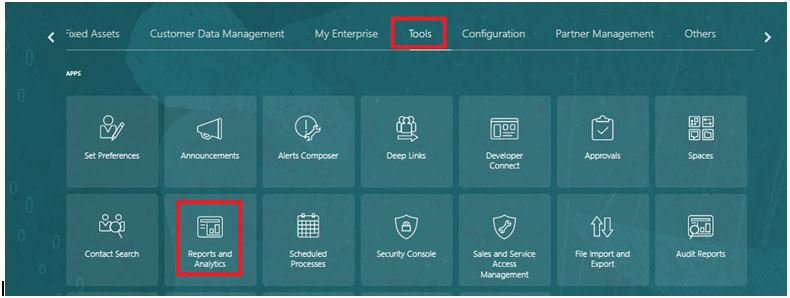
- Login into Oracle SaaS, navigate to Tools -> Reports and Analytics as shown in the below screenshot. Once the page is opened click on Browse Catalog and then the analytics page will be opened.
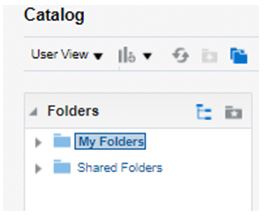
- The analytics catalog page contains two folders (My Folders and Shared Folders) as shown in the below screenshot. My Folders is only accessible to the logged-in user however the Shared Folders will be accessible to all users.
Note: It is always suggested to develop the Report and Data model in My Folders and post-development migrate them to Shared Folders.
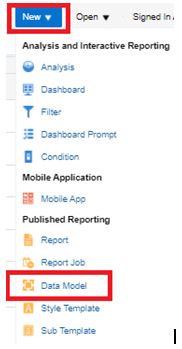
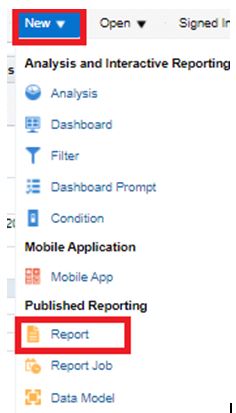
- Navigate to My Folders and click on New -> Data Model as shown in the below screenshot:
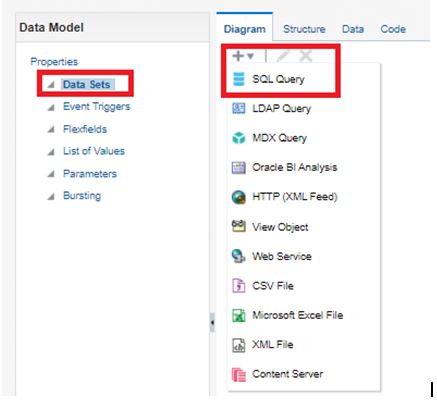
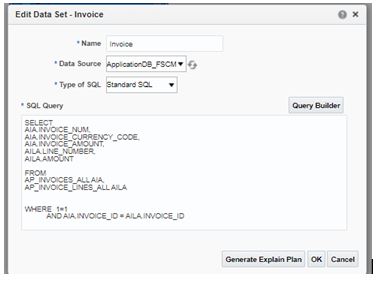
- Once Data Model is opened, click on Data Sets, click the + icon and select SQL Query to start writing the SQL Code
- The developer has to provide Name, Data Source, and Type of SQL and proceed with writing the SQL code in the text area provided as shown in the below screenshot and click Ok to validate.
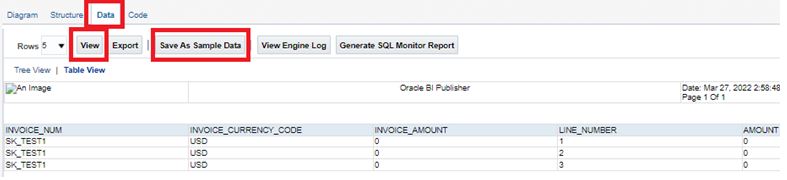
- To view data, click on the Data tab and click on View. Before proceeding with the Report development click on Save As Sample Data and save the data model.
Now our Data Model is ready. The next step is to create a Report.
Creating Report
- Click on New -> Report as shown in the below screenshot:
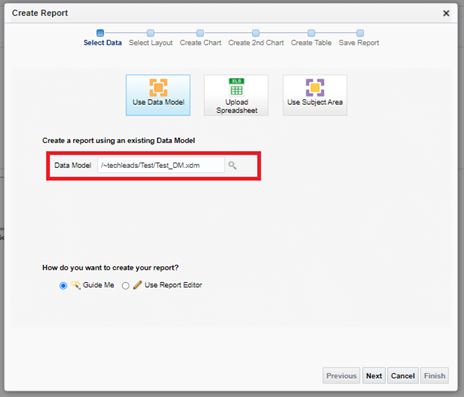
- Once the report is opened browse the saved Data model (created in the above steps) as shown in the below screenshot and click the Next button. For the current report, we will proceed with the creation of the online template.
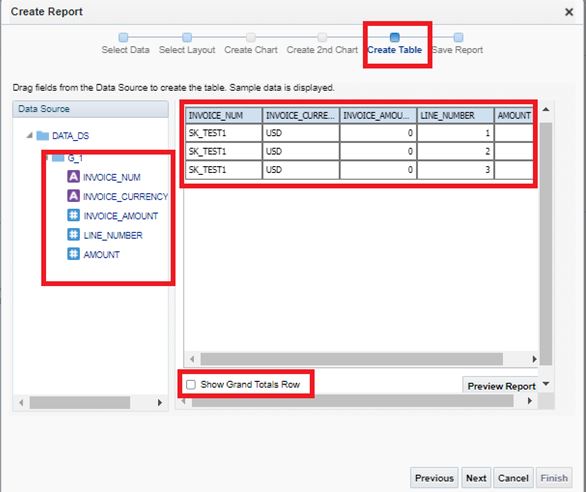
- Click Next until you reach the Create Table tab then drag and drop the fields as shown in the below screenshot and uncheck Show Grand Totals Row if not required. Finally, click the Next and Finish button to save the report.
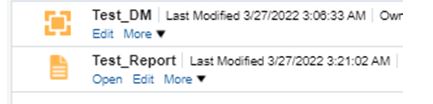
Both Data Model and Report are created successfully as shown in the below screenshot:
It’s time to test the Report.
Testing the Report
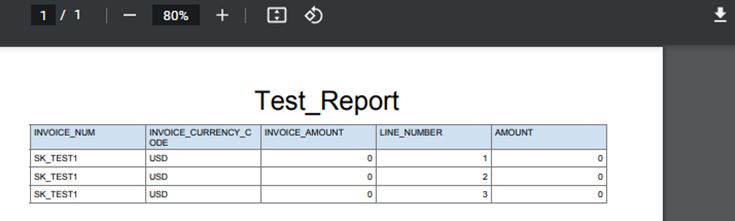
- To test Report, click on Open inline to the Test_Report as shown in the previous screenshot. The data will be visible in the PDF (default format) as shown in the below screenshot:
We have successfully created Data Model, Report and Tested the report. Now both Data Model and Report can be migrated to the Shared folder to be accessed by all users.
Also, please subscribe to our YouTube channel.
Thank you Ayyappa for writing this excellent blog.
Further Readings
Connect Stream using OCI Streaming adapter in Oracle Integration
Integrating Oracle Integration with API GW
Merge two different schema files into a single CSV file in Oracle Integration
How to create an Oracle APEX service
Insert data into a table using SQL in Oracle APEX
Form region to insert a record into a table in Oracle APEX
Master-Detail Page in Oracle APEX


