
Working with a Pie chart in Oracle Visual Builder
In this article, I am demonstrating how to work with a Pie Chart in Oracle Visual Builder.
Typically, Pie charts are used to show the relationship between parts and whole for categorical and nominal data. The parts in the piece represent the total percentages. The data with particular field will be grouped and the response would be in an organized way.
In this demonstration, I’m going to depict the percentage of students based on grades in a graphical view. Please follow below steps to create a Pie chart:
- Create a VB application along with a web application.
- Create a Students Business object with the following fields:
- Student Name
- Class
- Marks
- Grade
- Go to the Data tab and click on + Row to add some rows to Business Object.
For more detail on the creation of Business Objects please refer to our antecedent blog which includes the steps to create Business Objects.
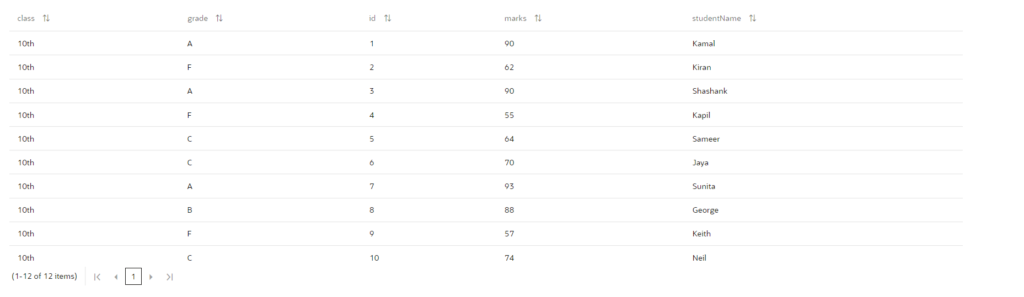
Inserted a couple of records for student data with different grades such as A, B, C, and F as shown in the following screenshot:
- The Pie chart will expect data in a particular format. We cannot directly assign the data to the pie chart variable. So we need to transform the table data and get the output in a piechart acceptable format.
- For that Navigate to the Types tab on our main-start page, click on + Type, and select Custom.
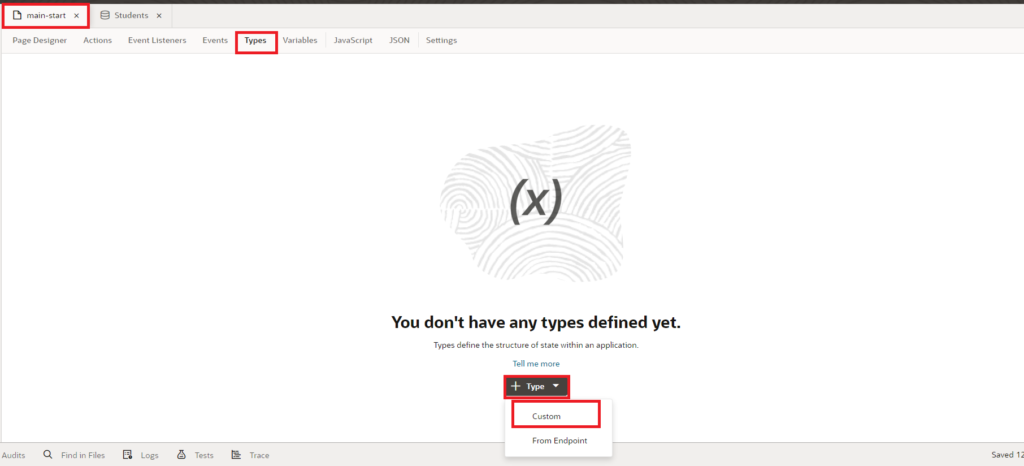
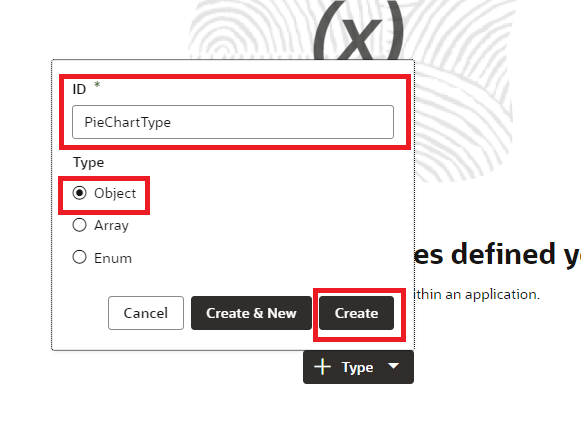
- On Selection of Custom, a popup opens up. Enter Id and select Object from the Type section and click on Create button as shown in the following screenshot:
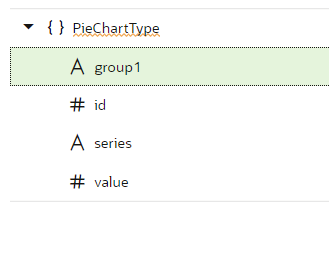
- Click on Add fields and add group1, id, series, and value to the object as shown in the following screenshot:
- Navigate to the Variables tab, click on + Variable, enter the Id, select Array Data Provider in the Type, and click on Create button as shown in the following screenshot:
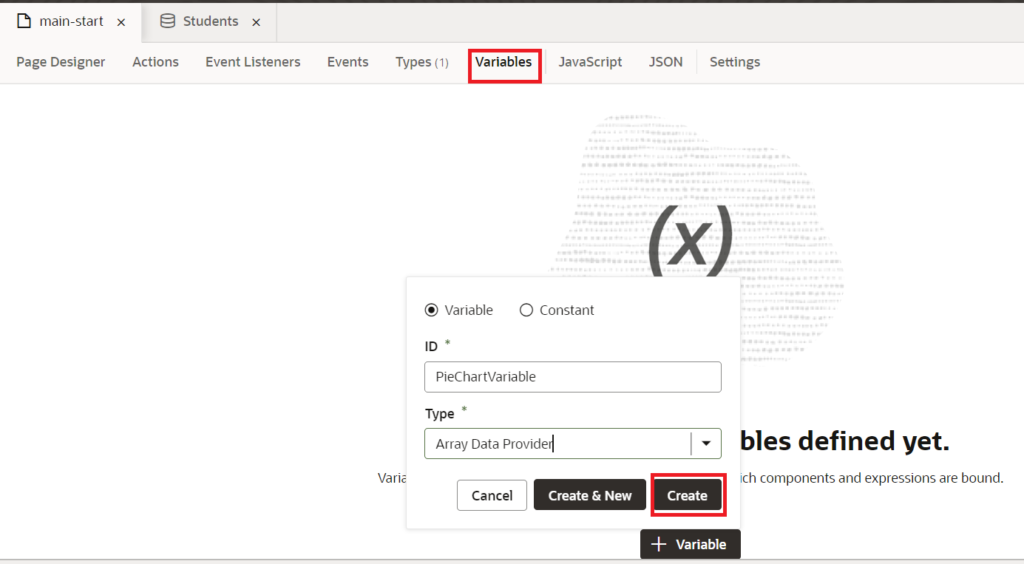
- Once the variable is created switch to the properties tab and select PieChartType as Item Type and id as Key Attributes.
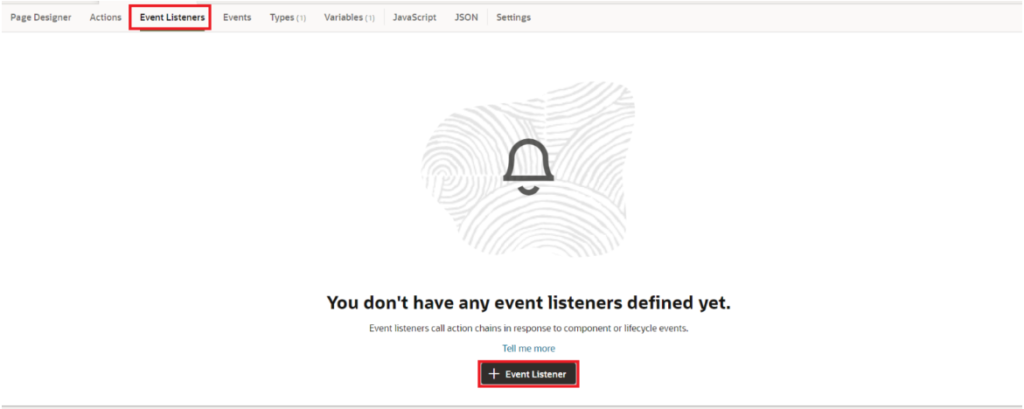
- We need to create an action to fetch the data from the Student BO. Hence, go to the Event Listeners tab, and click on the + Event Listener button as shown in the following screenshot:
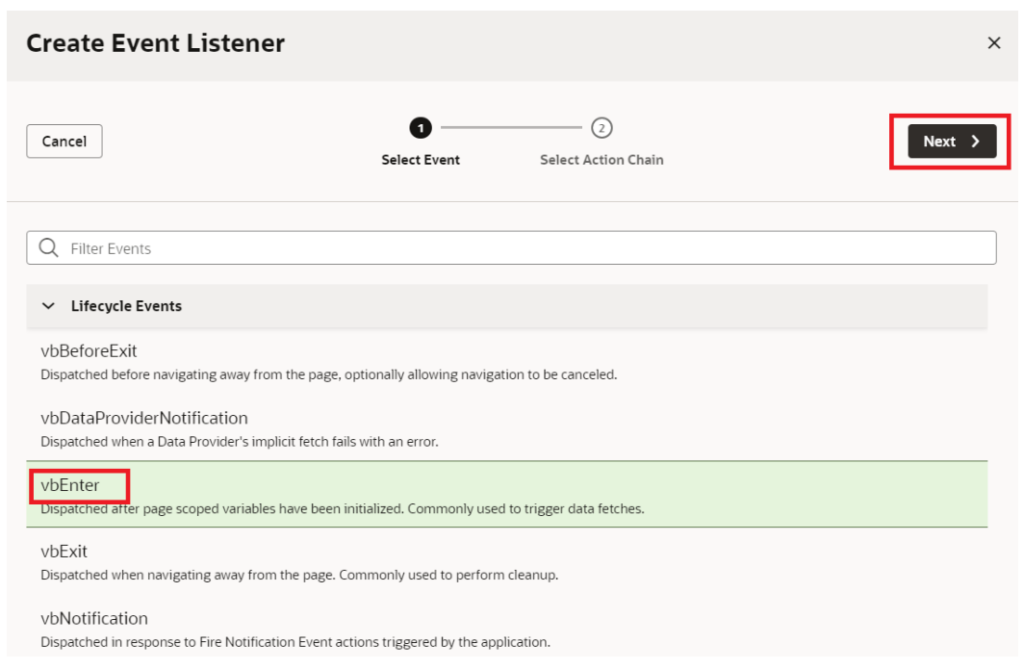
- select the vbEnter event and click on the Next button
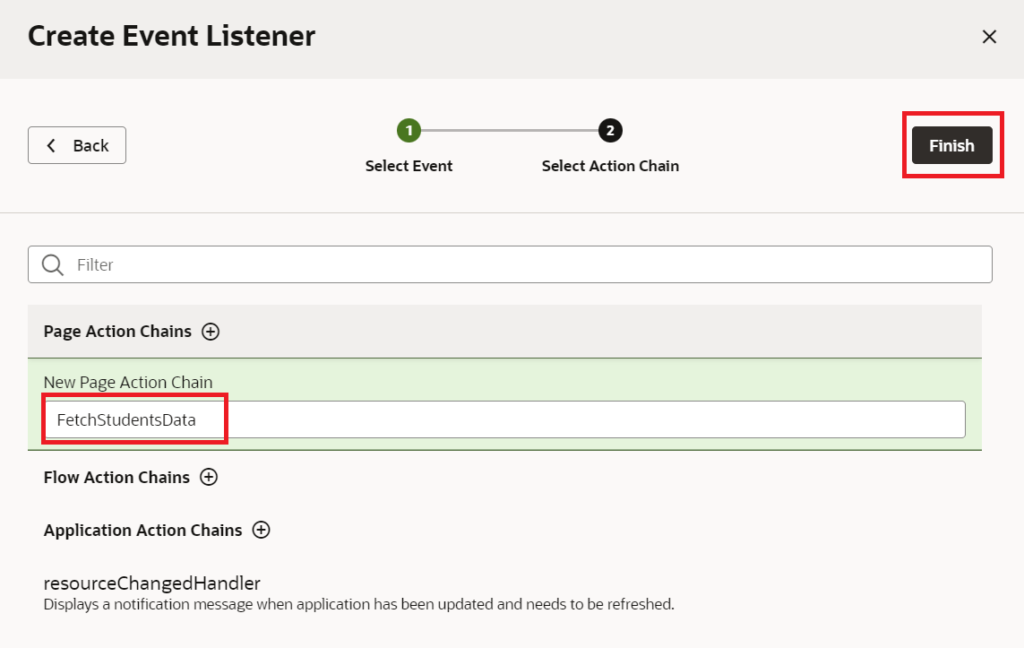
- Click on Page Action Chains + and enter the Id for the Action chain and click on the Finish button.
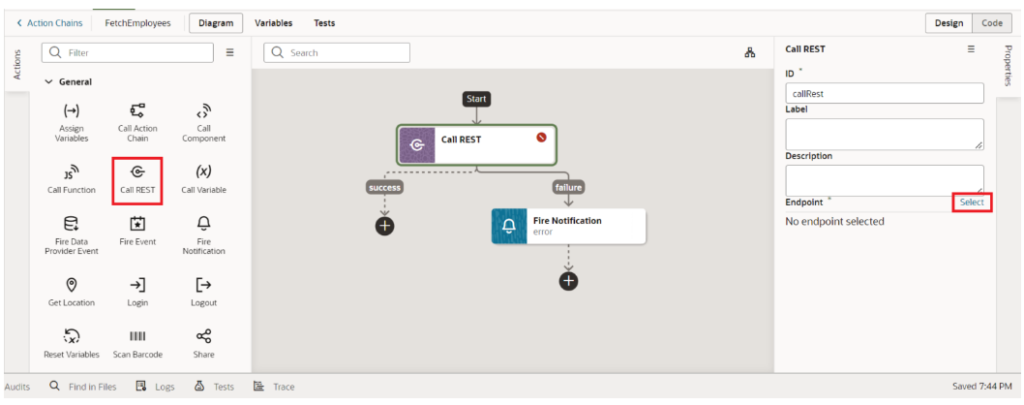
- Go to the FetchStudents action chain, and add call Rest action to the start node.
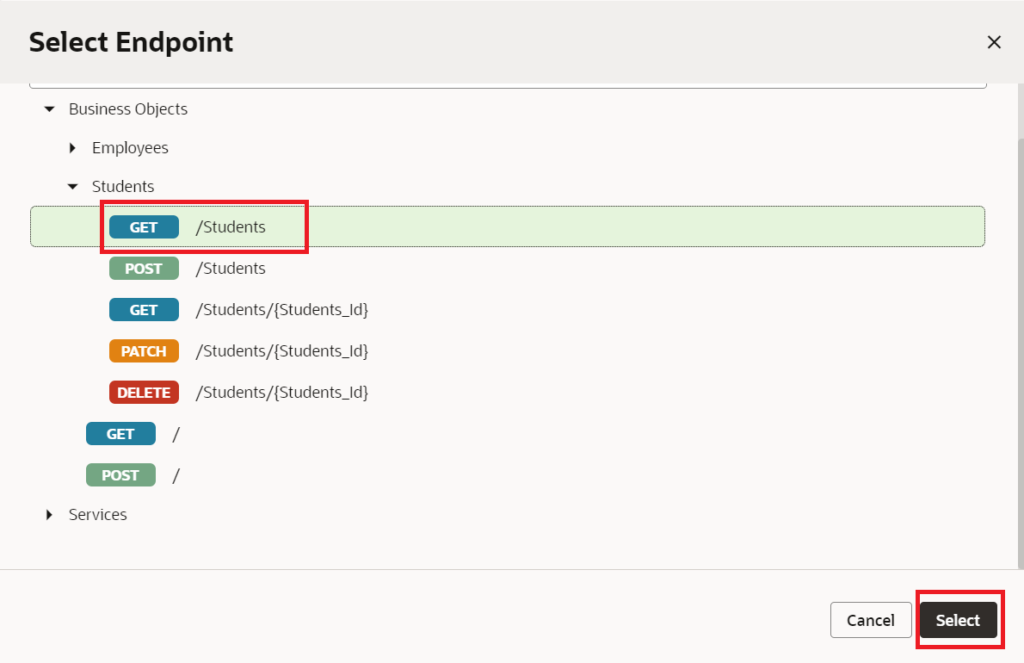
Select the GET /Students BO endpoint from the Students BO and click on the Select button.
After getting the response from the rest service we need to transform it to the PieChart type object.
- To process the response of the Business Object, the following JavaScript function is written on the page:
  PageModule.prototype.transform = function (result) {
    var newID = 1;
    var group = "students";
    let Agrade = 0;
    let Bgrade = 0;
    let Cgrade = 0;
    let Fgrade = 0;
    for (let i = 0; i < result.length; i++) {
      if (result[i].grade === "A") {
        Agrade = Agrade + 1;
      } else if (result[i].grade === "B") {
        Bgrade = Bgrade + 1;
      } else if (result[i].grade === "C") {
        Cgrade = Cgrade + 1;
      } else if (result[i].grade === "F") {
        Fgrade = Fgrade + 1;
      }
    }
    var items = [];
    items.push({
      id: newID++,
      group: group,
      series: "A",
      value: Agrade
    });
    items.push({
      id: newID++,
      group: group,
      series: "B",
      value: Bgrade
    });
    items.push({
      id: newID++,
      group: group,
      series: "C",
      value: Cgrade
    });
    items.push({
      id: newID++,
      group: group,
      series: "F",
      value: Fgrade
    });
    return items;
  };
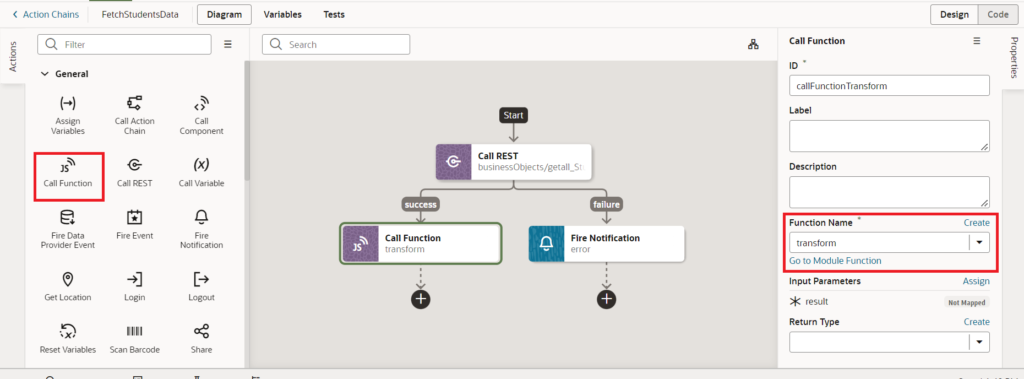
- In the action chain, drag and drop the Call Function action, and call the transform function.
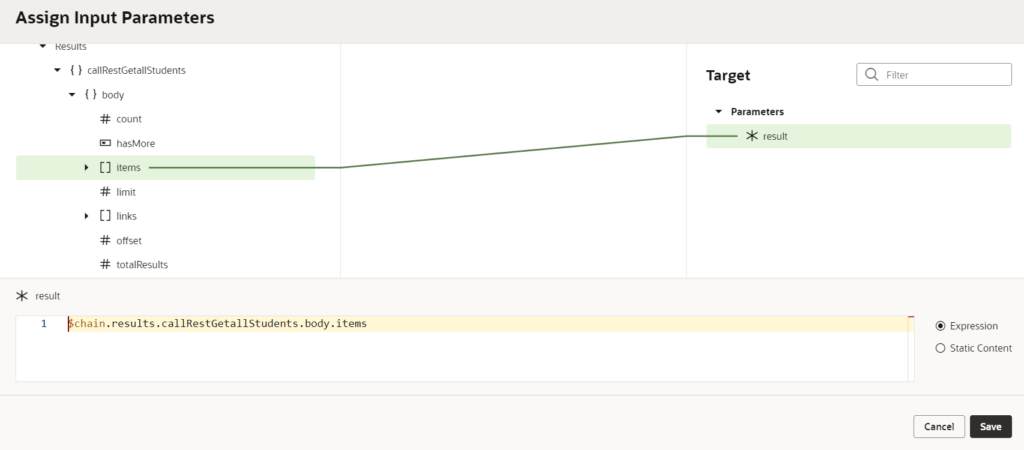
Map the []Items from the callRestGetallStudents to the results as shown in the following screenshot:
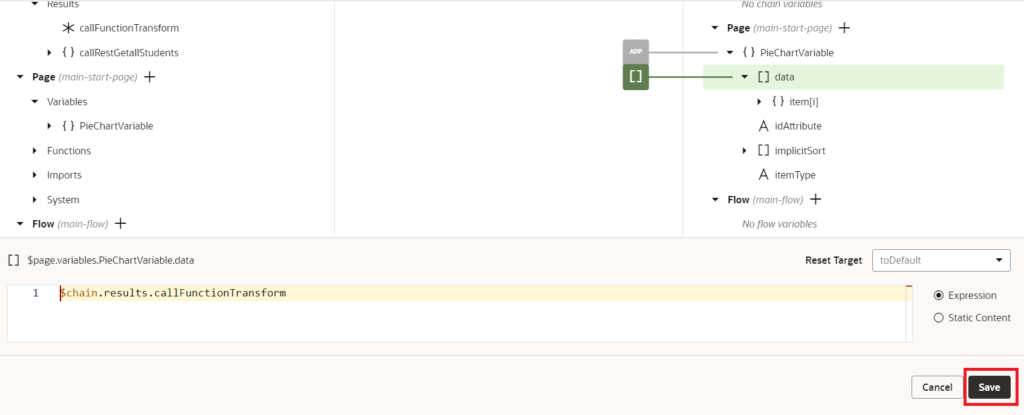
- Drag and drop the Assign Variables action after the Call Function action.
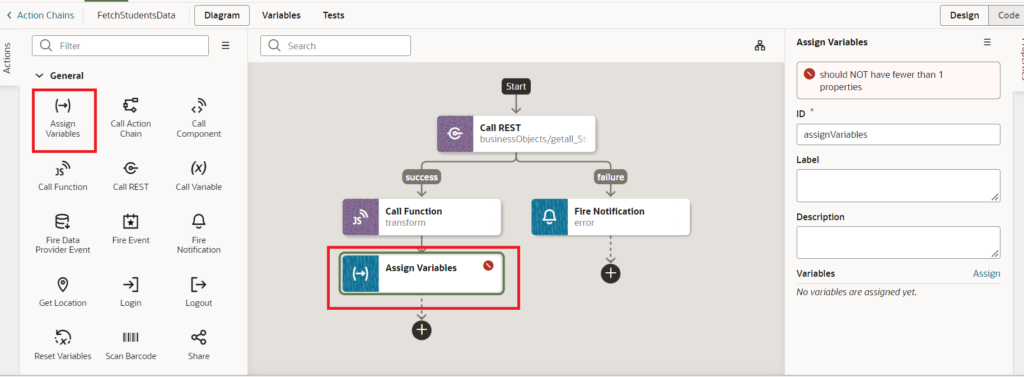
map the response from the callFunctionTransform to [] data of the PieChartVariable and click on Save button:
- Navigate to the Page Designer , drag and drop Pie Chart from the component pallet to the design area of the main-start page.
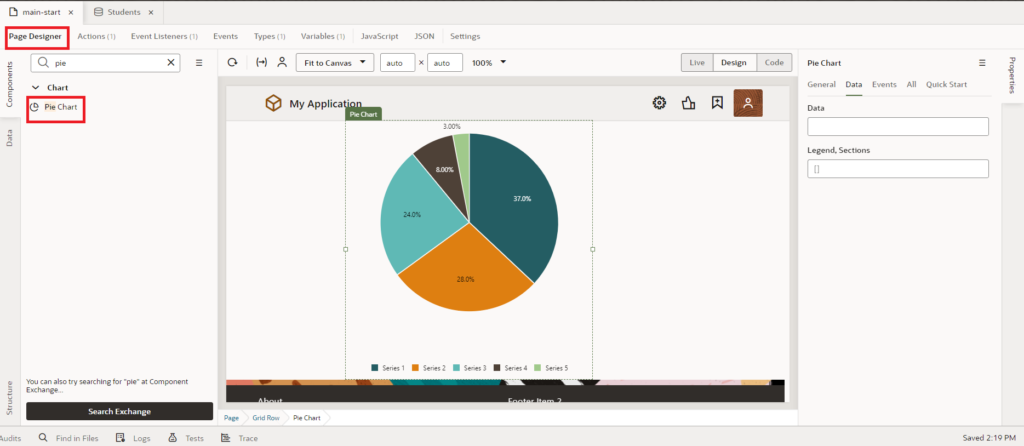
- Go to the Properties pane switch to the Data tab and select PieChartVariable from the variables as Data for the pie chart.
Go to code and add a template to specify the series ,value and group-id for the pie chart .
Finally, the Pie chart code should be like this:
    <oj-chart type="pie" data="[[ $variables.PieChartVariable ]]"
        id="statusChart" drag-mode="off">
        <template slot='itemTemplate' data-oj-as='item'>
         <oj-chart-item
            value='[[item.data.value]]'
            group-id='[[[item.data.group] ]]'
            series-id='[[item.data.series]]'>
          </oj-chart-item>
        </template>
      </oj-chart>
Now when you run the application you should be able to see the pie chart and when you hover on each part you should be able to see the % for that particular grade as shown in the following screenshot:
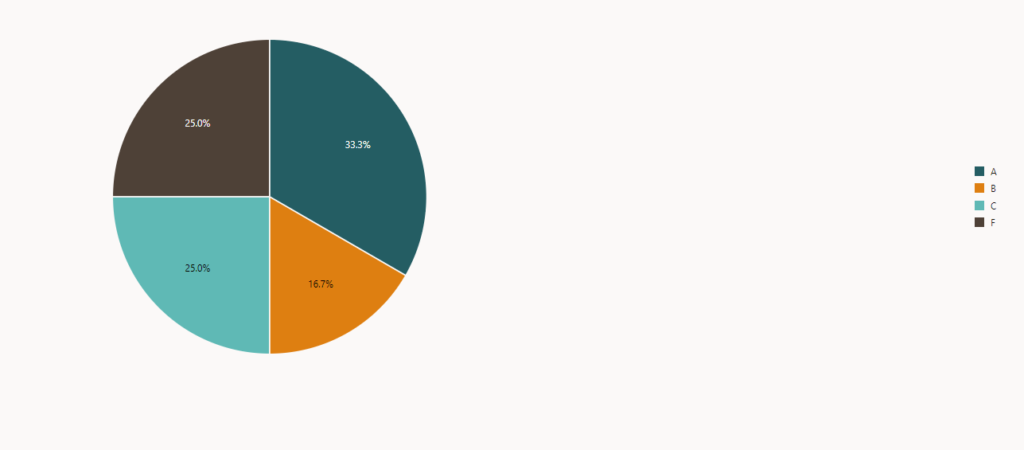
This is how we work with a Pie Chart in Oracle Visual Builder.
If you liked the article, please like, comment, and share.
Please look at my YouTube channel for Oracle Integration-related videos and don’t forget to subscribe to our channel to get regular updates.
Further Readings
Scheduled parameters to maintain Last Run Date Time in Oracle Integration
How to Customize the Lock Screen in Oracle Visual Builder
Merging two CSV files into a single file in Oracle Integration
ERP Integration using File Based Data Import: Oracle Integration


